At first glance, a single denormalized big-table seems like a reporting hero: no joins, just one table to maintain, and demo queries that fly. But the honeymoon rarely lasts. When real-world business demands hit, the simplicity turns out to be an illusion—and the design starts to bite back.
Below are reasons a big-table model quietly undermines good reporting, and why a star schema still earns its stripes when tools like PowerBI, Tableau, etc. are used. A big-table model has its justification, e.g. in building a machine learning model when the reasons mentioned below are not valid.
Semantic drift and column chaos
Without separate, conformed dimensions, every new business question spawns new columns—’customer_region,’ ‘cust_region,’ and ‘region_text’ might coexist in the same table. Since SQL lacks a central semantic layer, analysts must guess which variant is the ‘official’ one —a recipe for misreported KPIs and dashboard errors.
If you have two big-tables (like a lead table and a sales table), each will have its own version of customer data. When you reverse-engineer dimensions in a reporting tool, the resulting ‘customer’ dimensions will differ, confusing end users who expect consistency.
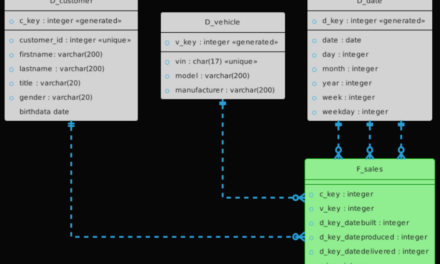
The whole complexity of the data model is moved into the reporting tool where the report designer/analyst ends up creating a star schema anyway.
History gets flattened (or forgotten)
In regulated industries or year-over-year analytics, you need slowly changing dimensions (SCDs). In big-tables, you typically overwrite historical values (losing audits) or add more columns like ‘product_name_v2,’ bloating the schema. Neither approach scales well. With a star schema, each table can retain its history cleanly and independently, using surrogate keys for time-travel queries and audit needs.
In a big-table different master data is mixed up each with its own history. If bitemoral history is required for each master data category, then happy maintenance of data quality debts.
Rigid grain limits ad-hoc questions
Big-tables are stuck at the grain you pick on day one—say, ‘order-line-item.’ If you later need daily visitor-level funnels, you must re-aggregate every query or remake the table. With star schemas, you can flexibly roll up facts along any dimension hierarchy—date, month, quarter—without rebuilding your model.
Maintenance turns into big deployments
Because logic and data are bundled, even a minor model tweak can mean backfilling or reloading the whole table. This prolongs pipeline runtimes and increases risk. In contrast, a star schema lets you surgically update a dimension or fact, isolating changes and minimizing downtime.
Still not convinced that big-table model is bad for reporting?
Still not convinced? Go hands-on and try building a dashboard in PowerBI, Tableau, or Apache Superset with a big-table. Apply filtering, drill-down, and drill-through. You’ll quickly realize the pain: complexity shifts into the reporting tool, performance drops, and clarity suffers. A big-table works for some use cases—like machine learning—but not for most reporting scenarios.
If you value simple, scalable, trustworthy reports—ditch the one-table myth. This also applies to the gold layer in a lakehouse, not just for classical DWH.